|
Box 1. Estimating the association between rates and compliance
Many considerations will go into the determination of the revenue neutral rate, but one of them
will also be the impact of rates on compliance. Theory suggests that increases in rates will lead
to reduced tax compliance. But is there any evidence from the experience of VAT itself?
Based on data provided by the IMF, the Committee undertook a simple econometric analysis
to test whether tax rates and compliance were correlated. Data was provided for 86 countries,
developed and developing. Compliance was measured in two ways: collection efficiency (CE)
and revenue productivity (RP). CE is measured as:
C-eff = R/(S*C)
where R stands for revenue collected, S is the standard rate and C is total final consumption
net of VAT collections. The denominator is a measure of the potential revenues that ought to
be collected and the numerator actual collections. C-efficiency is simply a measure of
comparing actual against potential. Revenue productivity (RP) simply replaces final
consumption with GDP in the denominator.
Simple regressions of the following form were run:
CE (RP) = α + A*S + B*ln(Y) + DUM+μ
Where the left hand side is either collection efficiency or revenue productivity; α is the
intercept term; S is the standard rate; Y is the per capita GDP of a country which controls for
other factors—such as quality of tax administration--that can affect collection efficiency; and
DUM is a dummy for country groups arranged according to income to again control for certain
group characteristics that might affect compliance; and μ is the standard error term.
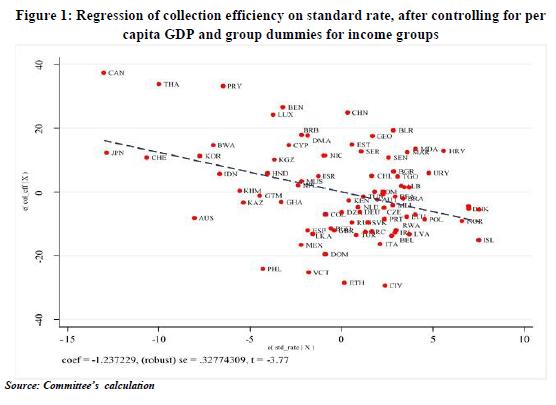
The regressions are shown in Tables 1 and 2. There is a very strong association between the
standard tax rate and all measures of compliance even after controlling for per capita GDP and
group dummies (Figure 1). For example, for collection efficiency the coefficient (A) is about
(-) 1.22. This suggests that a 1 percentage point increase in the standard rate worsens compliance by 1.22 percentage points.27
This has an important implication for the RNR in India. It suggests that a lower RNR will not
lead to as much of a loss in revenue as a simple calculation suggests. For example, if the
standard rate were reduced by say 4.1 percentage points in weighted terms that should increase
C-efficiency by 4.1 percentage points (using the conservative regression estimate of 1 rather
than 1.22) which amounts to about 9.3 per cent given the current C-efficiency ratio of 0.44.
Better compliance could therefore fetch potential additional revenues of nearly Rs 4.3 lakh
crore.
Table 1: Regression Results of Collection Efficiency
| |
(1)
Estimation 1 |
(2)
1 Estimation 2 |
|
Log per capita GDP |
7.16***
(1.40) |
7.20**
(2.89) |
|
Standard Rate |
-1.24***
(0.33) |
-1.22***
(0.35) |
|
Constant |
2.15
(13.04) |
-0.64
(24.85) |
|
Income Group FE |
No |
Yes |
| Observations |
84 |
84 |
|
Adjusted R2 |
0.293 |
0.276 |
Standard errors in parentheses
* p < 0.10, ** p < 0.05, *** p < 0.01
Collection efficiency (Revenue/(Standard Rate* Consumption))
Table 2: Regression Results of Productivity
| |
(1)
Estimation 3 |
(2)
1 Estimation 4 |
|
Log per capita GDP |
2.66*
(1.34) |
1.02
(2.46) |
|
Standard Rate |
-0.81***
(0.29) |
-0.85***
(0.31) |
|
Constant |
27.87**
(12.53) |
38.29*
(21.51) |
|
Income Group FE |
No |
Yes |
| Observations |
84 |
84 |
|
Adjusted R2 |
0.088 |
0.076 |
Standard errors in parentheses
* p < 0.10, ** p < 0.05, *** p < 0.01
Productivity (Revenue/(Standard Rate* GDP))
Notes:
1 The same regressions were carried out for more recent data (for the year 2012) for a set of 36 countries. The
results are similar with a strong and significant negative association between collection efficiency and standard
rates, although the coefficient is slightly smaller (close to 1).
|